Improved Heterogeneous Gaussian and Uniform Mixed Models (G-U-MM) and their use in Image Segmentation
© Mariana Rusu, Horia-Nicolai Teodorescu
This research was performed at Technical University “Gheorge Asachi” of Iasi with a support of AUF and Romanian Government.
It is published electronically as non-commercial research.
The materiel is offered “as such with no guaranty”.
In this page we present the image segmentation based on a set of new models named Gaussian – Uniform - Mixed Models (G-U-MM) that we also have described in [17-18], the steps of the algorithm, the obtained results and a comparison with other methods. For more details about G-U-MM see the references [17-18].
The first idea of segmentation method was presented of 4th International Conference Telecommunications, Electronics and Informatics – ICTEI 2012, Chisinau, Moldova. The follow text is extracted from the article presented at this conference: A method for image segmentation based on histograms – preliminary results, authors M. Rusu, H. N. Teodorescu.
“Segmentation represents the division of the image into areas by certain criteria. Usually, segmentation monitors the extraction, identification or recognition of an object in an image. Humans are able to separate objects in an image. It is because his prior knowledge necessary for understanding the objects and scenes. Developing segmentation algorithms that can "interpret" the images by extracting significant objects remains an unsatisfactory solved task.
The interpretation of an image is dependent on the objective analysis and on the person who makes the analysis.
There are many methods of image segmentation; the choice of technique depends on [1]:
- the nature of the image: lighting non-homogeneous, the presence of noise, glare, textured pattern, blurred;
- operations that are planned after segmentation: location, extent, pattern recognition, interpretation, diagnosis, quality control etc.;
- primitives to extract: outline, regions, shapes, textures;
- operating constraints: computational complexity, real-time function, memory size available.
The methods of segmentation can be grouped into four major categories:
- region-based segmentation. There are for example: region-growing [2], [3], split and merge [4], clustering method: k-means, fuzzy C-means [5];
- edge-based segmentation [6];
- thresholding - segmentation based on classification or thresholding of pixels according to their intensity [7], [8], [9];
- segmentation based on cooperation between the first three segmentations methodes [10]. ”
We propose a novel way of using the global statistics of gray images for image segmentation.
“Recall that a GMM model (exemplified here for the single variable case) consists of an approximation of a given probability distribution p(x) by a weighted sum of normal distributions” [18] and similarly, a UMM is a “approximation of a given probability distribution p(x) by a weighted sum of uniform distributions” [18]. In this way we construct a new histogram.
ALGORITHM
The segmentation methods based on histogram usually determine the thresholds as being the minimum values of the histogram. We propose another method of determining the thresholds that is illustrated in the flowchart in figure 1.
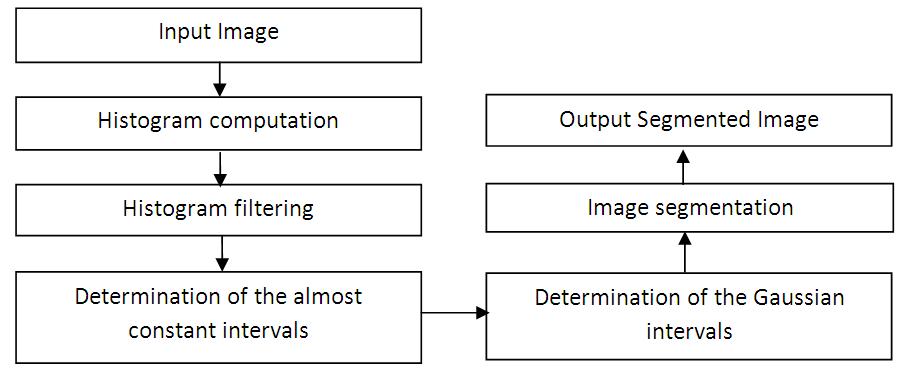
Fig. 1 Flowchart of the proposed method used for image segmentation
- The first steps of the method are represented by the computation of the image histogram, the filtering of the histogram using average and median filters, and the determination of the probability intervals that are almost constant. For obtaining a smooth histogram we applied the average filter twice and then the median filter, using a window of 11 samples, respectively 5 samples.
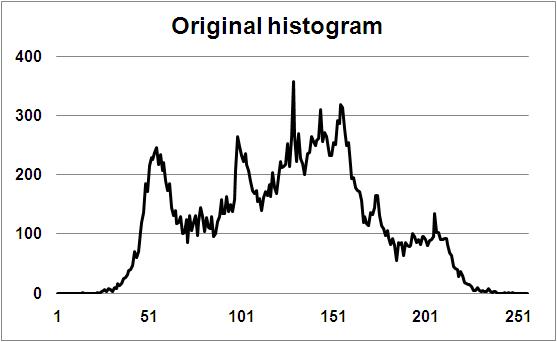
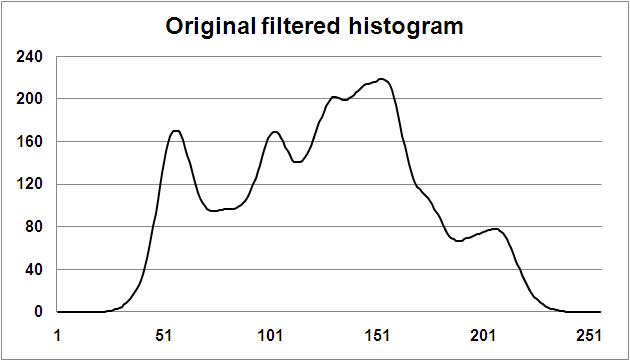
Fig. 2 Example of the original and filtered image histogram
- The almost constant intervals were determined using an overlapping window of 24 samples considering the following rules:
(a) IF THEN the interval is considered constant, where
  and
and  are the maximum and minimum values of the window and
  is the number of elements of the window. If two successive windows have this property we define the interval as being composed by both windows.
(b) ELSE the interval is considered not to be constant [ICTEI-2012]. - Let the interval [x1, x2] found as “undetermined type” – not constant (Fig. 3). Determine the center of interval and IF the center is bigger than the limits of interval THEN go to step 4, ELSE go to step 9.

Fig. 3 Fragment of histogram - Find the argument maximum of histogram that belongs to the interval.
- Suppose that x3 is Gaussian peak, THEN the histogram represents a normal distribution.
- Determine b1 for the left side:
for b=3 to 7200, we determine the error of approximation for Gaussian distribution.
Find b optimal corresponding on argument minimum of obtained errors. - Determine the error and b2 for the right size similar as in step 6.
- Determine b optimal as average of b1 and b2, and total error represent the sum of the both errors corresponding of b1 and b2.
- We determine the Gaussian intervals using an overlapping window of 24 items on the histogram considering the following: IF the average of 6 pixels from the center is bigger as the average of 6 pixels from the left AND as the average of 6 pixels from the right, then it is a Gaussian interval, ELSE - the interval is considered constant. For new Gaussian intervals determine the optimal b and calculate the error according to steps 6-8.
- For the constant intervals (with uniform distribution), we determine the error and the variance.
- Increments with each pixel the Gaussian on the left side; compute the error for Gaussian and uniform distribution. If the error for Gaussian is smaller, then we attach pixel to the Gaussian interval; if not check in the same way for the right side. If the pixel was assigned to the interval at left and/or right, then, we obtain and keep the new thresholds.
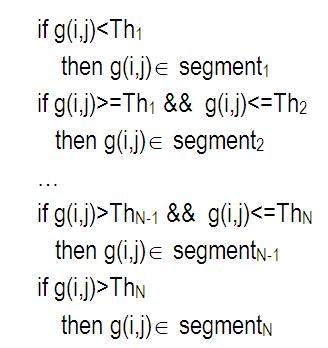
- The segmentation is performed according to the example of pseudo code, were Th1, Th2, … and ThN are the thresholds and g(i,j) is the pixel value of the image:
- We read the obtained results with Matlab.
IMAGES SEGMENTATION
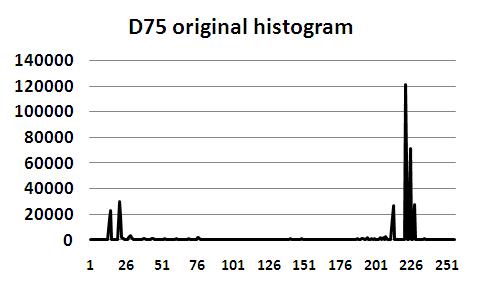
For the synthetic images, we determine the thresholds that represent the limits of the Gaussian and uniform intervals and we obtained quasi the same histogram.
 |
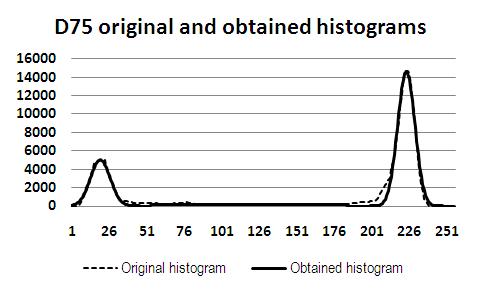 |
| Fig. 3 original and filtered histograms of the synthetic image D75 [11] | |
Click the link for view the original image http://www.ux.uis.no/~tranden/brodatz/D75.gif
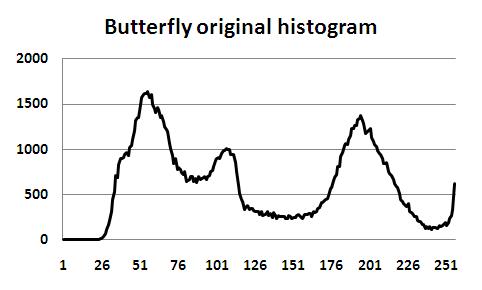
For the natural images (standard test images), we determine the thresholds, that represent the limits of the Gaussian and uniform intervals, but we not obtained the similar histogram.
 |
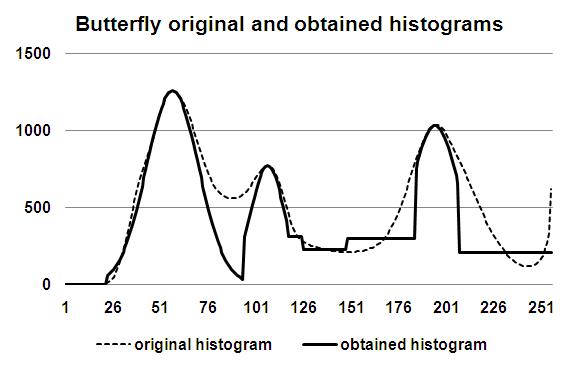 |
| Fig. 4 The original and filtered histograms of the test image butterfly [12] | |
Click the link for view the original image http://www.eecs.berkeley.edu/Research/Projects/CS/vision/bsds/BSDS300/html/dataset/images/gray/35010.html
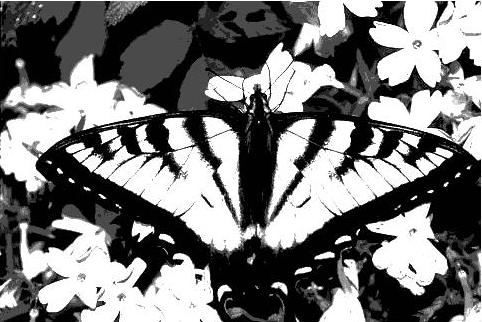
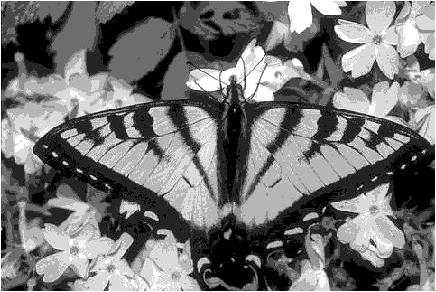
We decide to compare our results with other methods. We choose Multithresholding [15] and Otsu’s [14] methods, because the booth are based on the histogram.
| 8 segments | Thresholds of butterfly.jpg | Original filtered Histogram |
| Multithresholding method | 0, 82, 94, 120, 132, 151, 157, 163, 255 | 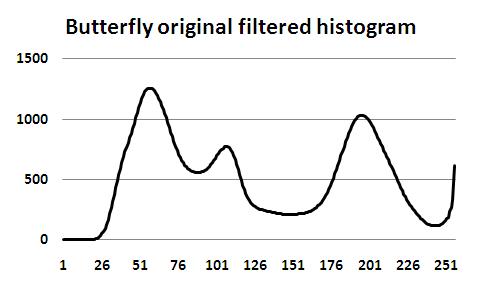 |
| Otsu's method | 0, 35, 59, 84, 116, 152, 183, 210, 255 | |
| Proposed method | 0, 23, 95, 118, 126, 149, 185, 208, 255 |
Fig. 5 The thresholds and original filtered histogram for test image butterfly
| Multithresholding method | Otsu’s method | Proposed method |
 |
 |
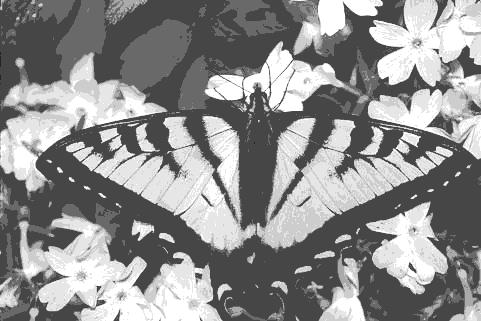 |
Fig. 6 The image butterfly segmented with different methods |
||
UNSUPERVISED PERFORMANCE EVALUATION OF RESULTS
A good segmentation evaluation method must be independent of the contents and types of image. It is necessary to determine most accurately the segmentation performance with minimal human involvement.
In the literature are many quantitative objective evaluation methods [12-13], including:
- F proposed by Liu and Yang;
- F′ and Q proposed by Borsotti, Campadelli and Schettini;
- Intra-region uniformity criterion of Levine and Nazif;
- E – based on empirical analysis, proposed by Zhang et al.
To see the calculation formulas consult [12-13] or evaluation_metrics.pdf
The |
Multithresholding method |
Otsu’s method |
Proposed method |
 |
 |
 |
|
F |
122837 |
80997 |
171164 |
F1 |
0.0008 |
0.0005 |
0.0012 |
Q |
0.0035 |
0.0013 |
0.0056 |
Lev |
0.84 |
0.85 |
0.65 |
E |
7.21 |
6.8 |
7.25 |
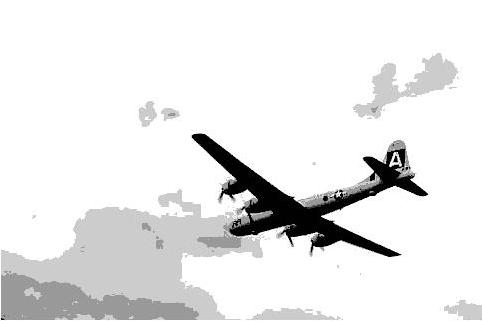
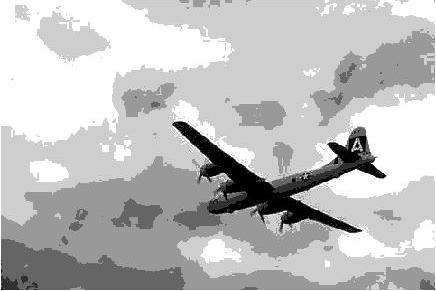
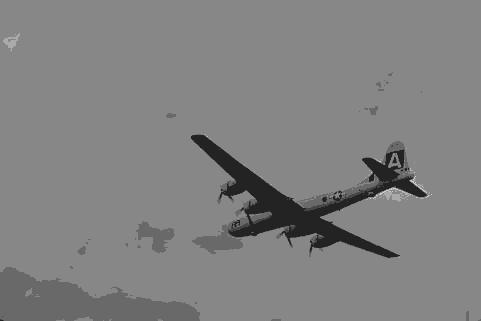
Fig. 7 The image airplane [12] segmented with different methods and the evaluation results
Click the link for view the original image http://www.eecs.berkeley.edu/Research/Projects/CS/vision/bsds/BSDS300/html/dataset/images/gray/3096.html
COMPARISON WITH OTHER METHODS
| The first method: | Image Multithresholding, by Nikos Papamarkos, 10 Jun 2010. This program performs Multithresholding (gray-scale reduction) [15]. |
| Description: | The program is based on the algorithm described in the following paper: N. Papamar-kos and B. Gatos "A new approach for multithreshold selection", Computer Vision, Graphics, and Image Processing – Graphical Models and Image Processing, Vol. 56, No. 5, Sept. 1994, pp. 357-370. |
| The second method: | Global image segmentation using Otsu's method. Copyright (c) 2010, Damien Garcia [16]. |
| Description: | Otsu's method finds the threshold that minimizes the weighted within-class variance. |
TABLE 1 Quantitative evaluation of the results
|
butterfly.jpg |
crow.jpg |
toadstool.jpg |
||||||
|
Multithresh |
Otsu |
Our |
Multithresh |
Otsu |
Our |
Multithresh |
Otsu |
Our |
F |
333665 |
189539 |
278709 |
156812 |
167009 |
161686 |
536348 |
283332 |
894916 |
F1 |
0.0026 |
0.0015 |
0.0021 |
0.0009 |
0.001 |
0.001 |
0.0031 |
0.0016 |
0.0047 |
Q |
0.0109 |
0.0040 |
0.0080 |
0.0029 |
0.0027 |
0.0031 |
0.0165 |
0.0053 |
0.0301 |
Lev |
1.37 |
1.23 |
1.21 |
0.81 |
0.72 |
0.84 |
1.06 |
0.72 |
0.76 |
E |
7.5 |
6.96 |
7.24 |
7.39 |
7.24 |
7.45 |
7.25 |
6.9 |
7.63 |
|
tree.jpg |
man.jpg |
velo.jpg |
||||||
|
Multithresh |
Otsu |
Our |
Multithresh |
Otsu |
Our |
Multithresh |
Otsu |
Our |
F |
264088 |
162774 |
250262 |
276064 |
184616 |
258816 |
510152 |
206983 |
485231 |
F1 |
0.002 |
0.0012 |
0.0019 |
0.0021 |
0.0014 |
0.002 |
0.0033 |
0.0013 |
0.0031 |
Q |
0.0076 |
0.0035 |
0.0071 |
0.0081 |
0.0039 |
0.0068 |
0.0160 |
0.0042 |
0.0105 |
Lev |
1.22 |
1.26 |
1.19 |
1.52 |
1.37 |
1.27 |
0.99 |
0.77 |
0.66 |
E |
6.89 |
6.71 |
6.83 |
6.8 |
6.58 |
6.62 |
6.96 |
6.69 |
6.77 |
|
horses1.jpg |
horses2.jpg |
bird.jpg |
||||||
|
Multithresh |
Otsu |
Our |
Multithresh |
Otsu |
Our |
Multithresh |
Otsu |
Our |
F |
803868 |
306373 |
570286 |
394983 |
277910 |
332983 |
190627 |
184290 |
269245 |
F1 |
0.0033 |
0.002 |
0.0037 |
0.0026 |
0.0018 |
0.0022 |
0.0012 |
0.0012 |
0.0017 |
Q |
0.0324 |
0.0073 |
0.0219 |
0.0114 |
0.0074 |
0.0090 |
0.0041 |
0.0030 |
0.0066 |
Lev |
0.23 |
0.77 |
0.78 |
0.99 |
0.84 |
0.85 |
0.79 |
0.86 |
0.81 |
E |
8.15 |
7.56 |
7.81 |
7.66 |
7.67 |
7.59 |
6.98 |
6.78 |
7.04 |
The results of Otsu’s method are better (by evaluation metrics) because this segmentation method search minimizing the intra-class variance.
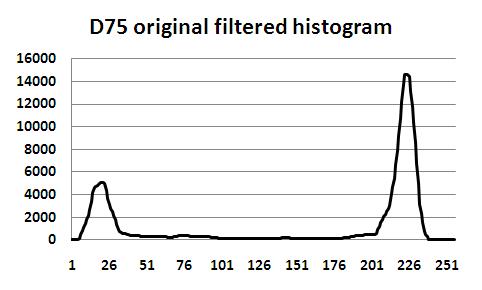
In order to make a comparison of the results of color image segmentation, by using the proposed method with other methods from the literature, we take into account primarily the number of obtained segments. For synthetic images the number of segments for multithresholding method is different as our and Otsu’s methods.
|
Thresholds of D75.jpg |
Original filtered Histogram |
Multithresholding method |
0, 17, 73, 113, 153, 231, 255 |
 |
Otsu’s method |
0, 25, 70, 255 |
|
Proposed method |
0, 54, 185, 255 |
|
|
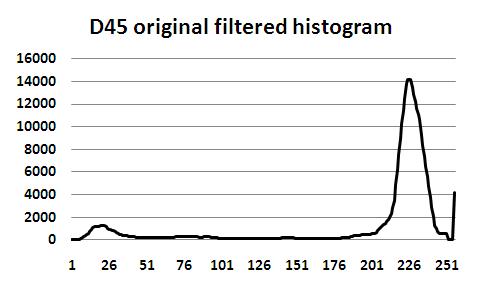
Thresholds of D45.jpg |
Original filtered Histogram |
Multithresholding method |
0, 68, 81, 113, 152, 255 |
 |
Otsu’s method |
0, 32, 76, 255 |
|
Proposed method |
0, 36, 185, 255 |
Fig. 8 The thresholds and original filtered histogram for synthetic images D75 and D45 [11]
It is not objective to compare our results with the results obtained with multithresholding method.
TABLE 2 The quantitative evaluation of obtained results with different methods
|
D45.jpg* |
D75.jpg** |
||||
|
Multithresh |
Otsu |
Our |
Multithresh |
Otsu |
Our |
F |
308741 |
817453 |
710026 |
287109 |
1202984 |
671566 |
F1 |
0.0005 |
0.0016 |
0.0014 |
0.0006 |
0.0019 |
0.001 |
Q |
0.0039 |
0.0176 |
0.0071 |
0.0038 |
0.0184 |
0.0047 |
Lev |
0.59 |
0.31 |
0.27 |
0.49 |
0.28 |
0.24 |
E |
7.4 |
7.5 |
7.43 |
6.61 |
7.2 |
7.18 |
* The recommended number of Thresholds is 5
** The recommended number of Thresholds is 6
Conclusions:
According to the criterion of efficiency, the proposed method is a simple one, having a minimal resource consumption and fast computation. The results achieved are numerically close to those obtained with other more complex methods.
Therefore, we conclude that the method is effective and satisfactory.
References:
- J.P.Cocquerez, S.Philipp, R. Zeboudj, Comparaison de méthodes de segmentation d’images, Quinzieme colloque GRETSI, 1995, pp. 1355-1360
- C. C. Kanga, W. J. Wang, C. H. Kang, Image segmentation with complicated background by using seeded region growing, I. J. Electronics and Communications, Vol. 66, No. 9, 2012, pp. 767–771
- A. Jellema et al., Landscape character assessment using region growing techniques in geographical information systems, J. Environmental Management, Vol. 90, No.2, 2009, pp. 161–174
- L. Liu, S. Sclaroff, Deformable model-guided region split and merge of image regions, Image and Vision Computing, Vol. 22, No. 4, 2004, pp. 343–354
- W. Cai, S. Chen, D. Zhang, Fast and robust fuzzy c-means clustering algorithms incorporating local information for image segmentation, Pattern Recognition, Vol. 40, No. 3, 2007, pp. 825 – 838
- Y. B. Chen, A robust fully automatic scheme for general image segmentation, Digital Signal Processing, Vol. 21, No. 1, 2011, pp. 87–99
- P. Zhongliang, C. Ling, Z. Guangzhao, Threshold segmentation using cultural algorithms for image analysis, Proc. of SPIE 6625, International Symposium on Photoelectronic Detection and Imaging 2007: Related Technologies and Applications, Vol. 6625, 2008, 8 pages
- O. J. Tobias, R. Seara, Image Segmentation by Histogram Thresholding Using Fuzzy Sets, IEEE Transactions on Image Processing, Vol. 11, No. 12, 2002, pp. 1457-1465
- K. Hammouche, M. Diaf, P. Siarry, A multilevel automatic thresholding method based on a genetic algorithm for a fast image segmentation, Computer Vision and Image Understanding, Vol. 109, No. 2, 2008, pp. 163–175
- B. Karasulu, S. Korukoglu, A simulated annealing-based optimal threshold determining method in edge-based segmentation of grayscale images, Applied Soft Computing, Vol. 11, No. 2, 2011, pp. 2246–2259
- The Brodatz Textures. Available: http://www.ux.uis.no/~tranden/brodatz.html
- The tested images. Available: http://www.eecs.berkeley.edu/Research/Projects/CS/vision/grouping/segbench/BSDS300/html/dataset/images.html
- H. Zhang, J.E. Fritts, S.A. Goldman, An entropy-based objective evaluation method for image segmentation, Proc. Storage and Retrieval Methods and Applications for Multimedia, 2004, pp. 38-49
- S. Philipp-Foliguet, L. Guigues, Multi-scale criteria for the evaluation of image segmentation algorithms, Journal of Multimedia, Vol. 3, No. 5, 2008, pp. 42-56
- N. Papamarkos, Image Multithresholding, 10 Jun 2010. Available: http://www.mathworks.com/matlabcentral/fileexchange/27871-image-multithresholding
- Global image segmentation using Otsu's method. Copyright (c) 2010, Damien Garcia. Available: http://www.mathworks.com/matlabcentral/fileexchange/26532-image-segmentation-using- otsu-thresholding/content/otsu.m
- H. N. Teodorescu, M. Rusu “Yet Another Method for Image Segmentation based on Histograms and Heuristics”, Computer Science Journal of Moldova, Vol.20, No.2(59), 2012, pp. 163-177.
Available: http://www.math.md/publications/csjm/issues/v20-n2/11087/ - H. N. Teodorescu, M. Rusu “Image Segmentation Based on G-UN-MMs and Heuristics - Theoretical Background and Results –” Proceedings of the Romanian Academy, Series A, Vol. 14, No. 1, 2013pp. 78–85.
Available: http://www.acad.ro/sectii2002/proceedings/doc2013-1/12-Teodorescu.pdf
Acknowledgments
This work was developed during M. Rusu’s PhD research internship at the Technical University “Gheorghe Asachi” of Iasi; the scholarship was offered by the Romanian Government managed by the Francophone University Agency.
M. Rusu especially thanks H. N. Teodorescu, the scientific adviser in this stage for contributions to the thesis research project.
Authors' contributions
HNT proposed the research topic, the approach, the models, the method of solving the segmentation, the algorithm; he interpreted most of the results and derived conclusions.
MR wrote the code, performed simulations and experiments, contributed to the interpretation of the results, wrote the text for this page and alone produced the largest part of processed images. Both authors discussed the content of this page and agreed with its final form.

This work is licensed under a Creative Commons Attribution-NonCommercial-NoDerivs 3.0 Unported License
Note: This page was created at the initiative of Professor Horia-Nicolai Teodorescu.